
Pendahuluan
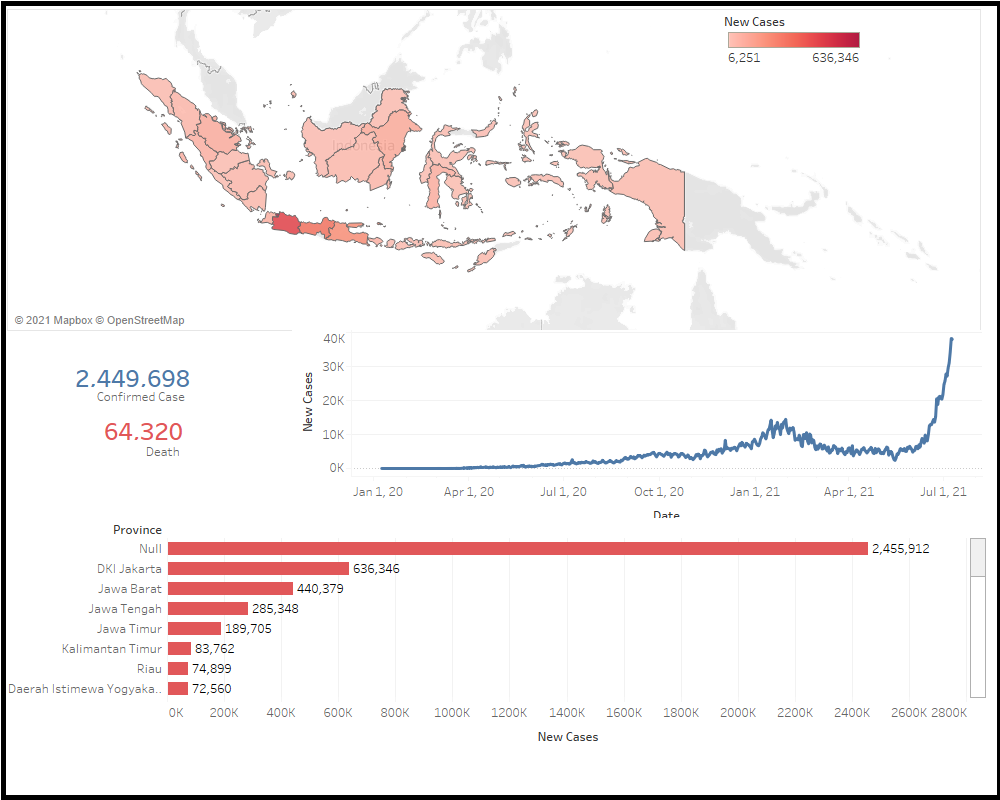
The continued spread of coronavirus disease is rapidly changing how organizations across the globe operate. Leading your organization through this change starts with data, and our mission at Tableau is to help people see and understand their data. The Tableau COVID-19 Data Hub contains resources to help you visualize and analyze the most recent data on the COVID-19 outbreak. This includes starter workbooks to help you kick-start your analysis as well as data sources that can be combined with your internal data.
Project information
| Category | : | Data Visualization |
| Project Date | : | Jun 2021 |
| Project URL | : | Tableau for Covid19 |
| Article | : | Tableau for Covid-19 | Tools | : | Tableau, Excel, Jupyter |
Abstract - MoSV1D
The continued spread of coronavirus disease is rapidly changing how organizations across the globe operate. Leading your organization through this change starts with data, and our mission at Tableau is to help people see and understand their data. The Tableau COVID-19 Data Hub contains resources to help you visualize and analyze the most recent data on the COVID-19 outbreak. This includes starter workbooks to help you kick-start your analysis as well as data sources that can be combined with your internal data.